Module Overview
pccx-lab is a Tauri 2 desktop app for verification and profiling
of the pccx NPU architecture. Phase 1 of the roadmap split the
original monolithic core into nine focused Rust crates under
crates/ plus a top-level React ui/ tree. Rather than enumerate
each crate here, the overview groups them into four conceptual
layers — see design/rationale for the full
list and design/phase1_crate_split
for the dependency graph.
Layer |
Crates |
Role |
|---|---|---|
Core |
|
|
Derivatives |
|
specialised producers that consume the core surface (reports, CI gates, ISA/API TOML compilers, EAGLE-family primitives) |
IDE + services |
|
the experience surface and the network / language-server lanes that plug into it |
Bridges |
|
non-Rust boundaries: SystemVerilog/UVM over DPI-C, and LLM invocation wrappers |
Dependencies flow inwards only — every non-core crate depends
on pccx-core (transitively on none), and no crate depends on
pccx-ide or pccx-remote (both are terminal binaries). pccx-core
must never import a UI or framework crate; ui/ only talks to
pccx-ide through the Tauri IPC bridge.
Shell at a glance
The default layout mirrors a modern EDA IDE (think VTune / Nsight): a top menu bar, a tool ribbon, a tab strip, the active work panel, and two dockable side panels (Live Telemetry + AI Copilot).
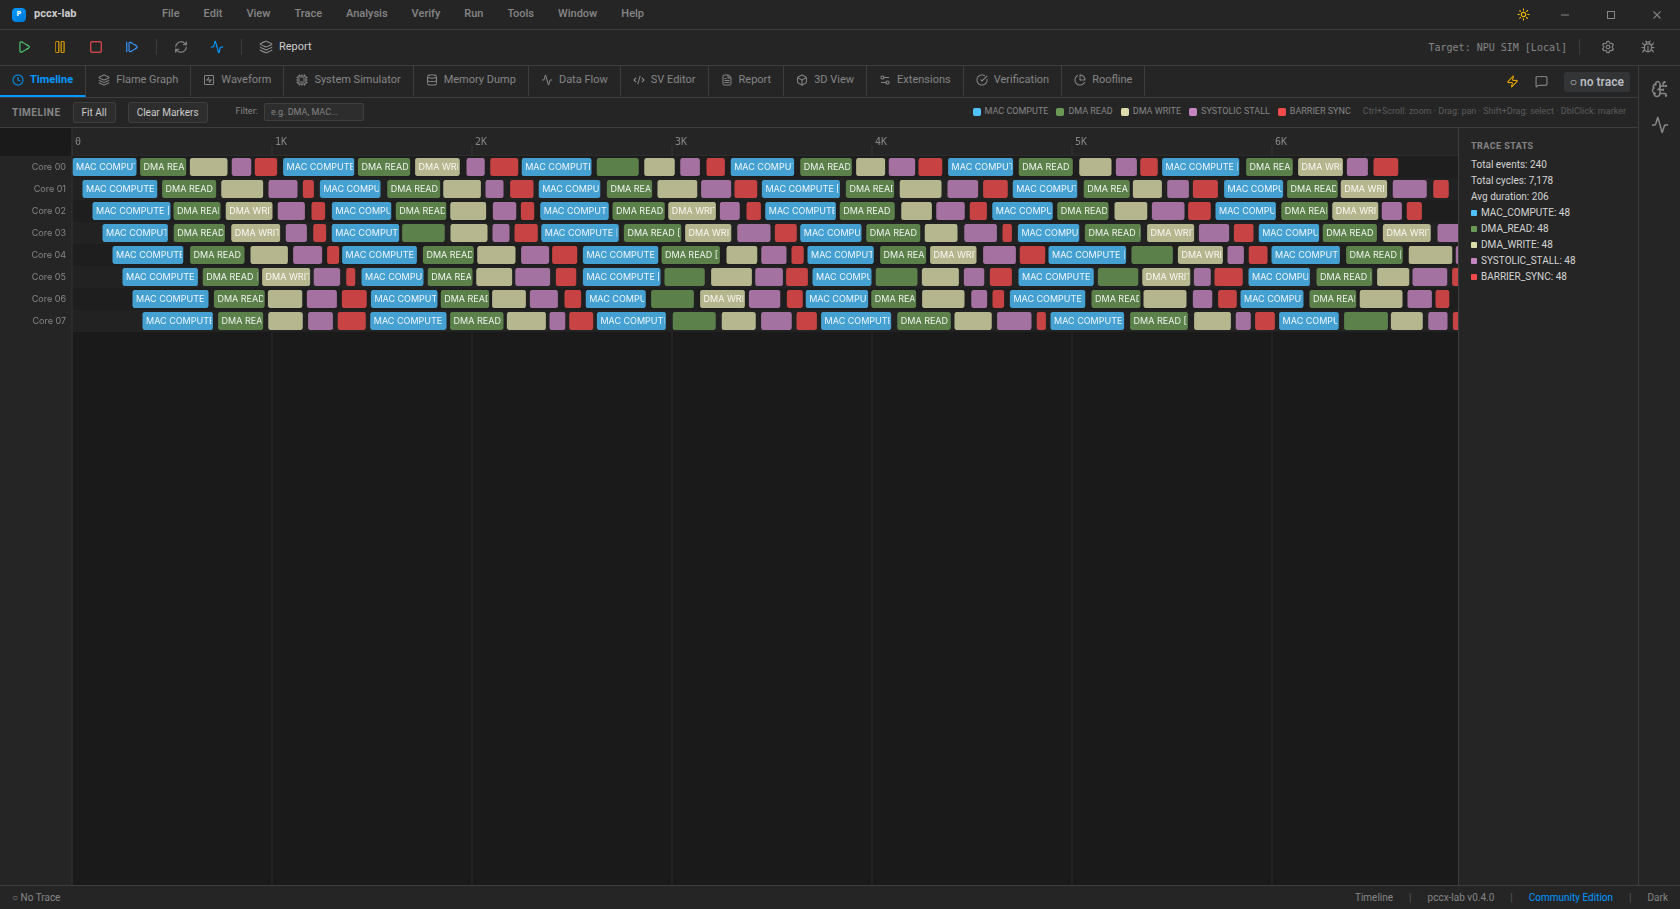
The capture above shows the Timeline tab. Each swim lane is a
core; events are colour-coded by type
(MAC_COMPUTE / DMA_READ / DMA_WRITE / SYSTOLIC_STALL /
BARRIER_SYNC). The right-hand stats panel is driven by the Rust
core_utilisation IPC.
Main tabs (2026-04-20)
Tab |
Component |
Hot-key |
Purpose |
|---|---|---|---|
Timeline |
|
— |
Swim-lane event timeline over cycles |
Flame Graph |
|
— |
Hierarchical stall / compute stacks |
Waveform |
|
— |
Signal waveforms (future VCD sink) |
System Simulator |
|
— |
3D systolic array live view |
Memory Dump |
|
— |
Paginated hex view of the flat trace buffer |
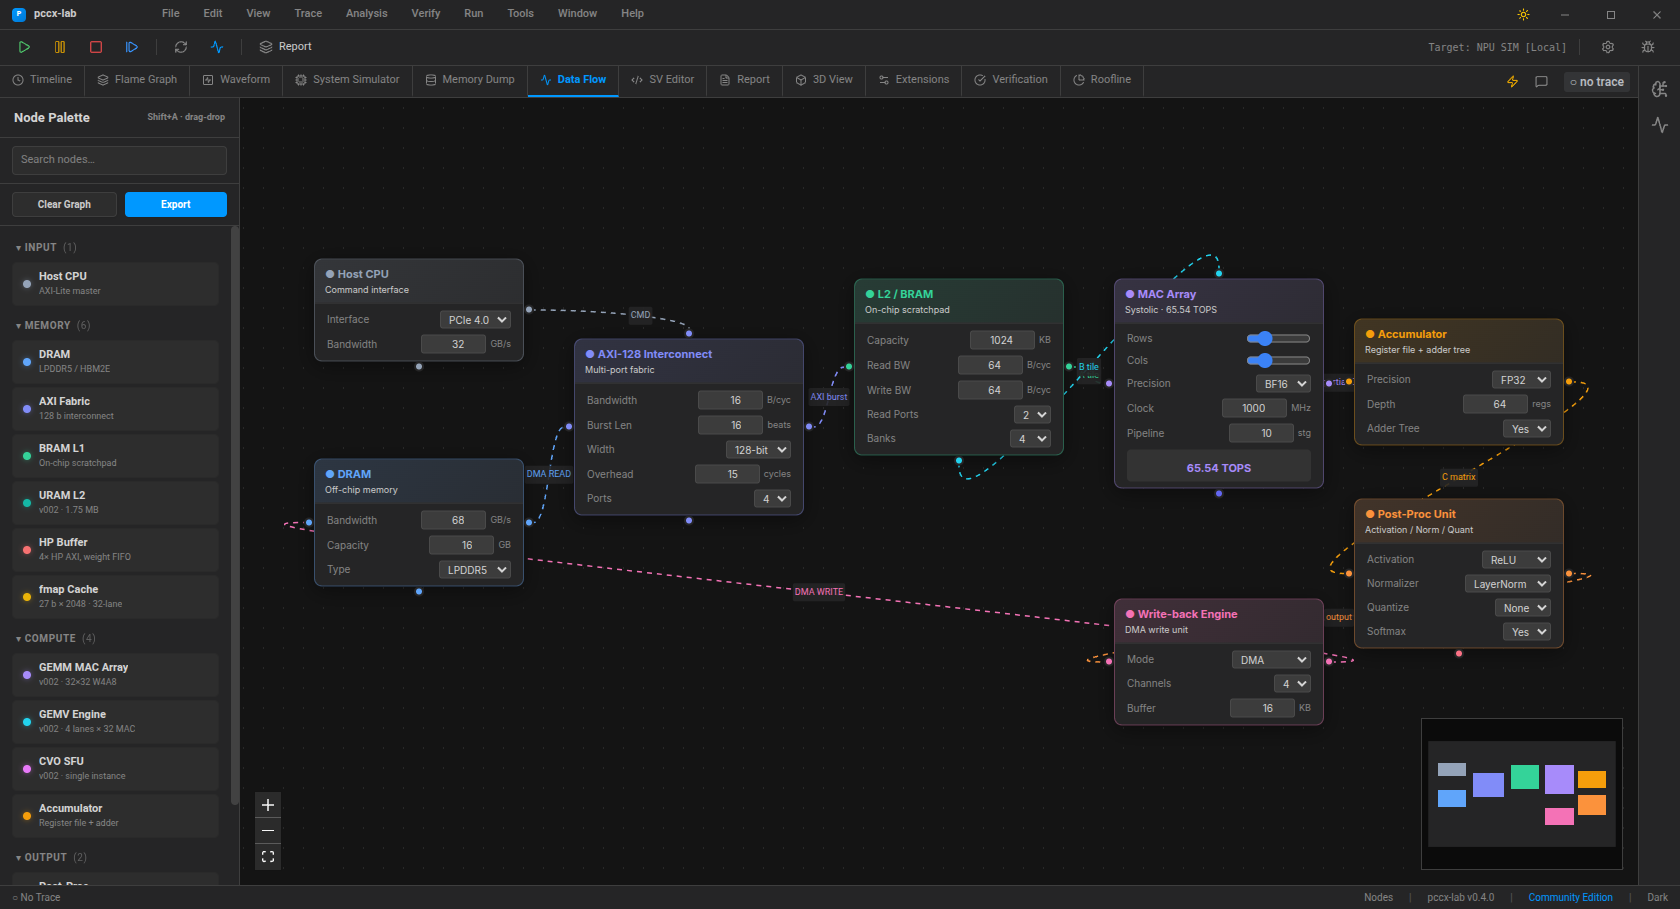
Data Flow |
|
Shift+A |
Blender-grade block-diagram canvas |
SV Editor |
|
— |
SystemVerilog editor + AI inline gen |
Report |
|
— |
Enterprise report composer |
Verification |
|
— |
4-card pccx-FPGA verification dashboard |
Roofline |
|
— |
ECharts roofline chart |
Verification dashboard (pccx-FPGA bridge)
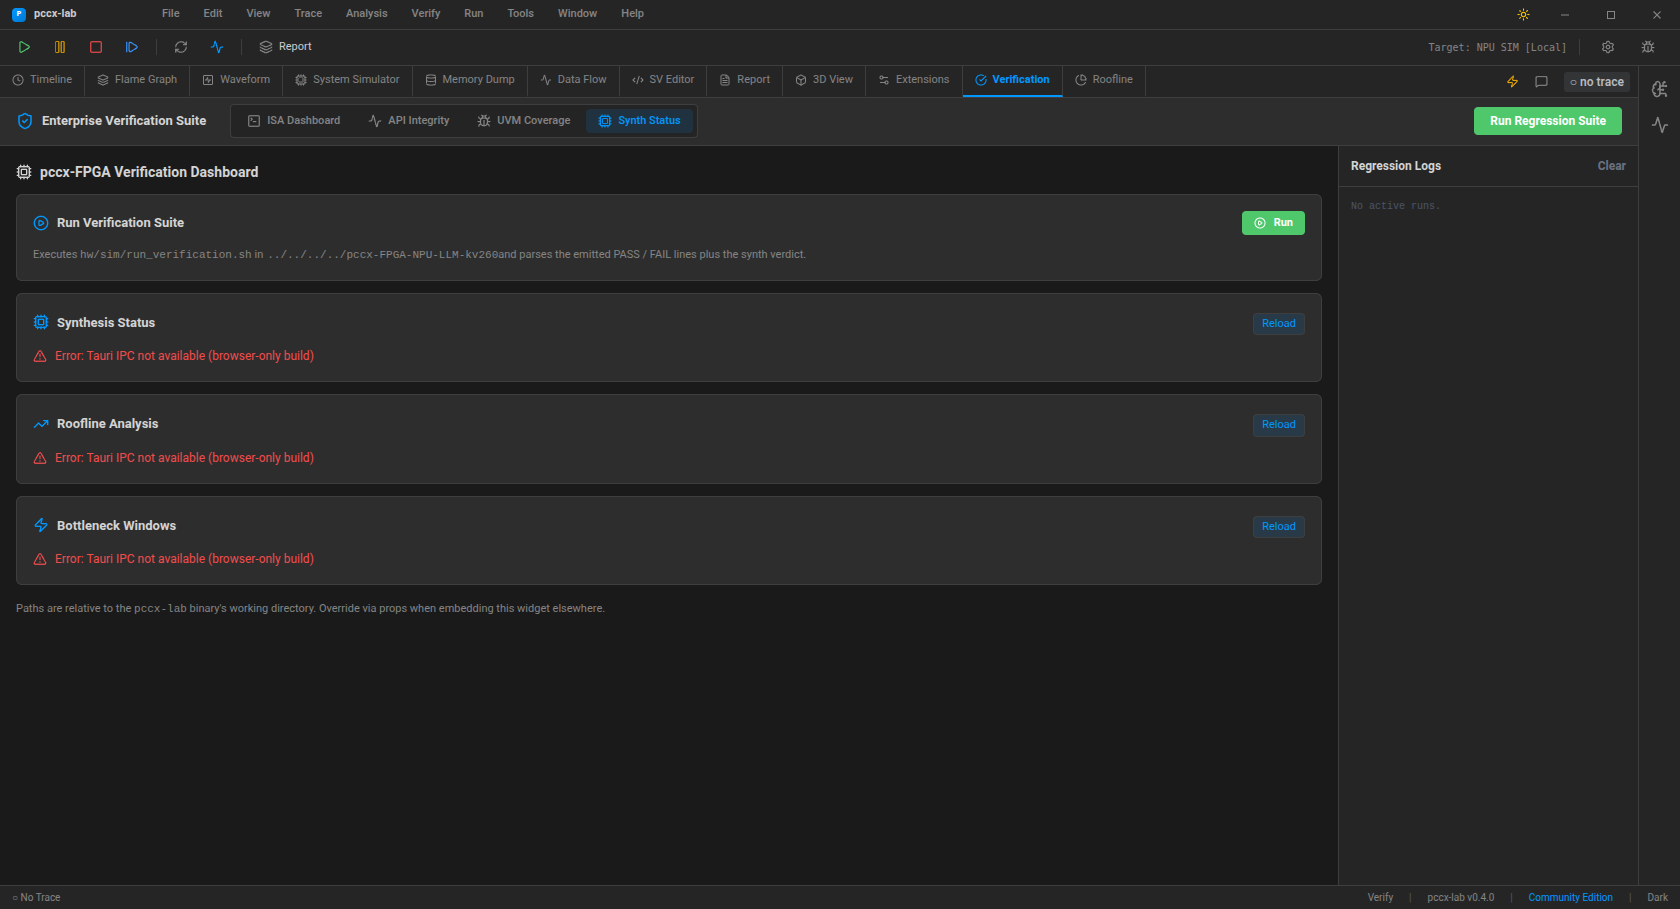
The Verification → Synth Status sub-tab is the one-stop dashboard for pccx-FPGA RTL verification. Four cards stack top-to-bottom:
Run Verification Suite — shells out to
hw/sim/run_verification.shin the sibling pccx-FPGA repo and returns the per-testbench verdict table. Each row has an Open button that loads the generated.pccxinto the Timeline via thetrace-loadedevent bus.Synthesis Status — parses
hw/build/reports/{utilization,timing_summary}_post_synth.rptand surfaces LUT / FF / RAMB / URAM / DSP counts plus the WNS timing verdict.Roofline Analysis — arithmetic intensity, achieved GOPS, compute-vs-memory-bound verdict, computed on the currently-cached trace.
Bottleneck Windows — fixed-window DMA / stall hotspot list with share %, event count, and core coverage (normalised).
See Verification Workflow for the end-to-end flow.
Tauri IPC surface (17 commands)
Command |
Purpose |
|---|---|
|
Cache a trace + emit |
|
Flat 24-B/event buffer for the Timeline |
|
Per-core MAC-utilisation stats |
|
LLM-prompt-sized trace summary |
|
SV UVM sequence stub |
|
Enumerate the 5 built-in strategies |
|
Legacy enterprise report |
|
Markdown summary of trace + synth |
|
Arithmetic intensity + bound verdict |
|
Hotspot window list |
|
Parsed Vivado synth report |
|
Run the full pccx-FPGA suite |
|
Enumerate |
|
Tier + licensee + expiry |
|
Compiled-in tier |
|
Plugin catalogue (local LLM, VCD exporter, …) |
Native-window automation
Everything above runs in a real webkit2gtk webview driven by
tauri-driver — the same E2E harness that CI uses. The
Verification Workflow page spells out the selenium +
tauri-driver setup; 19 pytest cases currently exercise the whole IPC
surface end-to-end.